
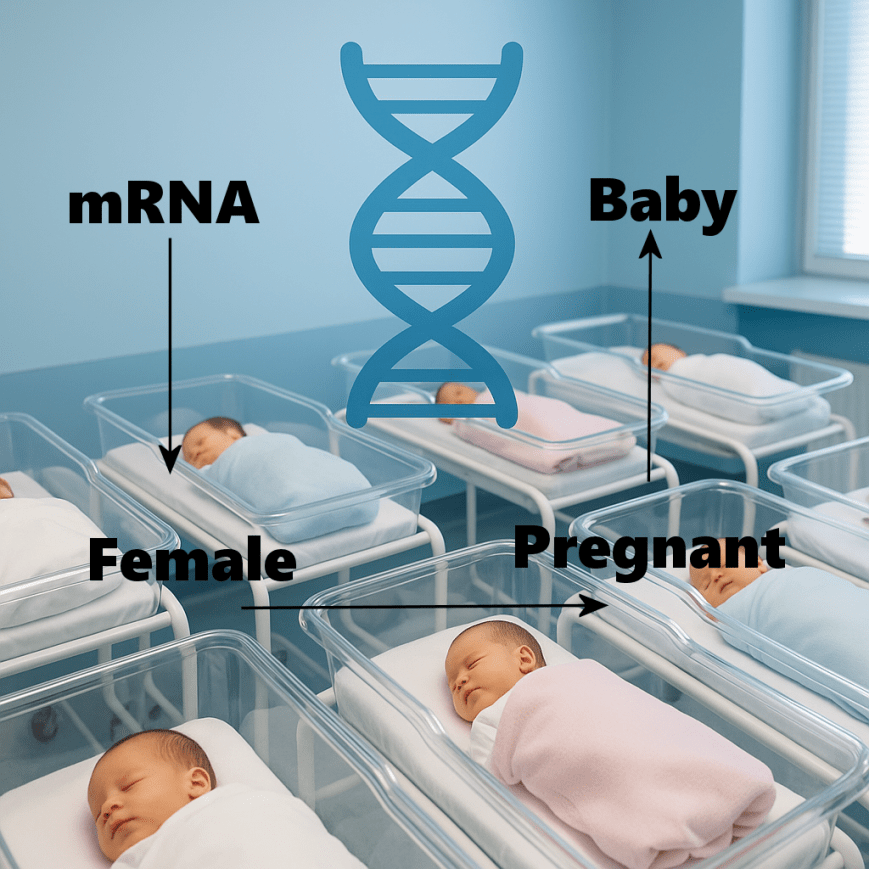
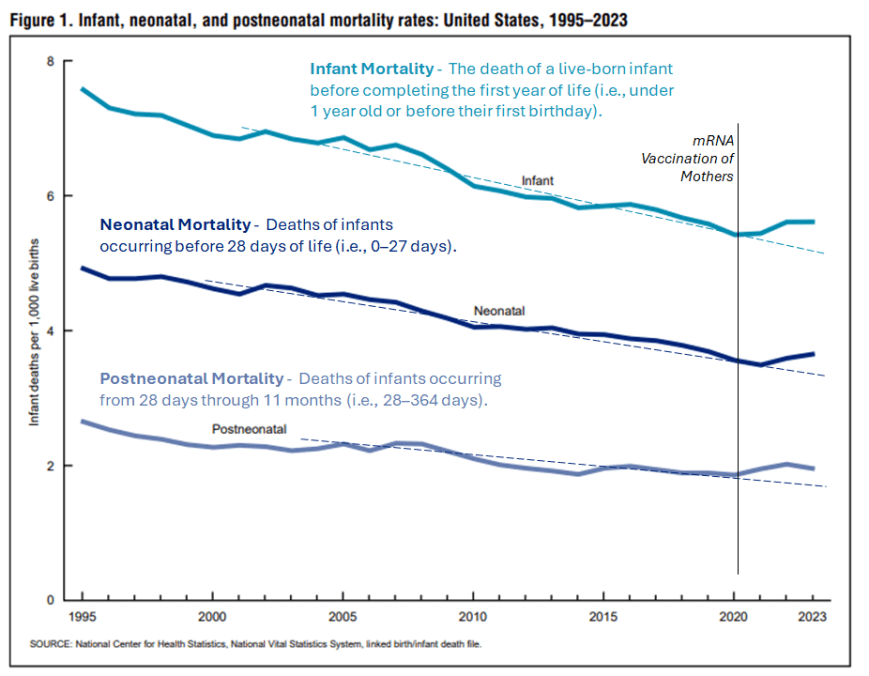
Figure 1 shows devastating US infant, neonatal, post neo-natal mortality 1995-2023, fingering Malone Bourla Pfizer et al. mRNA vaccine, genome integration & transgenerational transfer mother to child
in utero! To emerge in child in FUTURE? ‘The Ethical Skeptic’s damning thesis is worth the read! Title: ‘Houston, We Have Another Problem’ as showcases a troubling signal of excess infant and child
| DR. PAUL ALEXANDER OCT 18 |
mortality in those who ‘neither contracted Covid-19 nor received the vaccine themselves, but whose parents bore prior mRNA exposure. The evidence points to two neglected risks—teratogenic effects passed in utero and transgenerational epigenetic effects transmitted through germline biology—together forming a warning of historic consequence for generations yet unborn.’ See Figure 1.
‘In the context of mRNA vaccination, concern centers on the passage of synthetic mRNA instructions and their biological consequences through the female ovary–egg–zygote cycle, where exposures affecting germline cells may be encoded into embryonic development and transmitted to descendants.’
It is clear in Figure 1 based on the dramatic uptick in mortality (see right side of graph as the downward pattern and trend is reversed 2020 onwards) that there is some level of future transgenerational catastrophic impact on future generations…starting, baked into our infants. What have we done?
I call on RFK Jr. et al. to read this very troubling piece of work by The Ethical Skeptic about the transfer of the mRNA vaccine and its effects to the baby re teratogenic effects passed in utero and transgenerational epigenetic effects transmitted through germline biology—together forming a warning of historic consequence for generations yet unborn.
We are talking about the devastating effects on future generations.

War and vaccine, two of the same.
Title:
‘Houston, We Have Another Problem’; ‘The Ethical Skeptic’
Excellent thesis by The Ethical Skeptic, please support.
Read from here:
‘We again invoke the Apollo 13 crew’s now-immortal phrase, “Houston, we have a problem,” as the title-thematic of this article—offered as a direct continuation of our earlier blockbuster report, Houston, We Have a Problem. That first analysis marked the earliest significant identification of morbidity and mortality impacts associated with the Covid-19 mRNA vaccine. It stood as a “shot heard around the world,” revealing excess non-Covid natural-cause mortality across multiple ICD-coded categories documented within the National Vital Statistics System (NVSS). Much as thalidomide once forced medicine to reckon with teratogenic risk, these findings underscored the ethical necessity of considering systemic, population-wide harms that may only emerge through rigorous epidemiological tracking.
Alexander News Network (ANN): Trump’s War 2.0 for America is a reader-supported publication. To receive new posts and support my work, consider becoming a free or paid subscriber.
Now, a parallel recognition confronts us—not within our own generation, whose members bore the primary exposure to the vaccine, but rather within the realm of our heritable biology. The detectable signal has shifted downstream, appearing in our youngest children: those who neither contracted Covid-19 nor ever received an mRNA injection, yet who manifest the biological consequences of their parents’ exposure (Chen, et al.; 2025: “In this study, mRNA-1273 intramuscularly given to pregnant mice rapidly circulated in maternal blood and crossed the placenta within 1 h to spread in the fetal circulation.”).1
This emergent pattern suggests not merely an immediate pharmacological effect, but the unsettling possibility of developmental and epigenetic inheritance—echoes of intervention carried into lives that never consented to it.
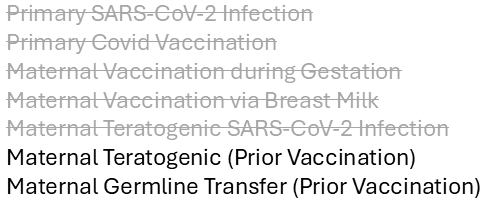
The mRNA vaccination program—rushed into deployment under an imperious, treatment-embargoing emergency use authorization (EUA)—carries with it two overlooked categories of risk, which this article addresses directly:
- Teratogenic potential (adjective phrase) — The possibility of inducing congenital morbidity or mortality in those exposed in utero. Refers to any agent or factor capable of causing malformations, developmental abnormalities, or functional deficits in an embryo or fetus during pregnancy. In the context of mRNA vaccination, concern centers on the passage of synthetic mRNA instructions and their biological consequences through the placental barrier, where such exposures may be encoded into embryonic and fetal development.
- Transgenerational / Epigenetic potential (noun phrase) — The possibility of producing biological changes in health, development, or disease risk in generations never directly exposed to the original agent. Unlike genetic mutations, these effects arise through heritable epigenetic mechanisms—such as DNA methylation, histone modification, or non-coding RNA—that alter gene expression across generations. In the context of mRNA vaccination, concern centers on the passage of synthetic mRNA instructions and their biological consequences through the female ovary–egg–zygote cycle, where exposures affecting germline cells may be encoded into embryonic development and transmitted to descendants.
What follows is an examination of the data signals emerging from national vital statistics and mortality datasets. Our approach draws on methods from both systems science and epidemiology, relying heavily on a technique central to our signal detection: Deviation from Trend analysis (DFT Charting). This method allows us to isolate meaningful departures from long-established baselines, revealing anomalies that conventional year-over-year comparisons often obscure.
Rather than relying on raw mortality counts—which naturally fluctuate with seasonality, demographics, and shifts in diagnostic practice—we focus on whether mortality curves themselves exhibit inflections. An inflection is a statistically significant and sustained change in a trajectory’s slope, rate, or variability, occurring in temporal association with a specific intervention or event. To strengthen this analysis, we will cross-reference findings with the CDC/NCHS’s own published data (Chart 1) and confirm them through raw mortality charting as well (Chart 5).
By concentrating on the points where long-established declines in infant and child mortality were broken, and by measuring how sharply the new trajectories deviate from their expected baselines, we can detect signals that would otherwise be lost in statistical noise.
The data used in this study are not projections or speculative estimates, but are drawn directly from the CDC WONDER / NCHS Multiple Cause of Death database, which records every U.S. death certificate. For this analysis, we isolate mortality in children ages 0–4, exclude deaths formally attributed to Covid-19 (ICD-10 U07.1), and compare the observed outcomes against 25-year-stable pre-2020 legacy benchmarks (see Chart 1).
This approach enables us to separate ordinary year-to-year fluctuations from extraordinary, persistent departures—shifts that align temporally with the introduction of mRNA vaccination among childbearing populations.
Teratogenic Potential
Chart 1: Infant, Neonatal, and Postneonatal Mortality (1995–2023)
This chart, from the National Vital Statistics Reports Volume 74, Number 7 June 10, 2025 Infant Mortality in the United States, tracks infant deaths per 1,000 live births across nearly three decades. Until 2021, mortality rates trended steadily downward, reflecting advances in maternal care, neonatal medicine, and socioeconomic improvements. However, the period commencing with and following 2021 shows a break in that 25-year consistency: instead of declining further, neonatal and postneonatal mortality abruptly change from a legacy trend, to an entirely novel one.
The vertical marker identifies the introduction of mRNA vaccination among, not only expectant mothers, but future mothers as well, during the February to June 2021 timeframe. The disruption in trajectory aligns temporally with this intervention, suggesting possible teratogenic influences. While temporal association alone does not constitute definitive proof of mechanism, the mechanism has in fact already been observed,2 3 and this reversal of decades-long progress warrants critical examination.
For children aged 0-4 years, acute otitis media, acute upper respiratory tract infections, jaundice, and gastro-intestinal problems have increased the past two years.
~ Dr. Carla Peeters, Children’s Health: By the Numbers, Brownstone Journal; 19 Apr 20244
Transgenerational / Epigenetic Potential (Vaccinial Generation)
Chart 2 & 3: All Natural Causes of Death in Vaccinal Generation (Ages 0–4)
Here, mortality deviations from the expected baseline are charted for children born after maternal and maternal candidate vaccination. The persistence of this deviation well into a period when more than 90% of the U.S. population had ceased further mRNA vaccination suggests that the effect is not confined to exposures during pregnancy. Rather, it points to an impact carried forward from prior vaccination in women who later became pregnant—indicating that the risk extends beyond gestational exposure to include those merely planning to conceive in the future.
The data, sourced from CDC WONDER, exclude all deaths directly attributed to Covid-19. The brief spike visible in late 2019 and early 2020 reflects a dry-tinder effect—mortality rising among already-vulnerable populations—occurring during a period when the virus was either not yet formally detected or not yet recognized as having reached U.S. shores. This is followed by a subtle pull-forward effect (PFE) visible in the variance data over the subsequent eight months. Neither of these 2020 artifacts is incorporated into the baseline trend alignment of the chart, which, as the reader will note, remains anchored to the more stable 2018–2019 period.
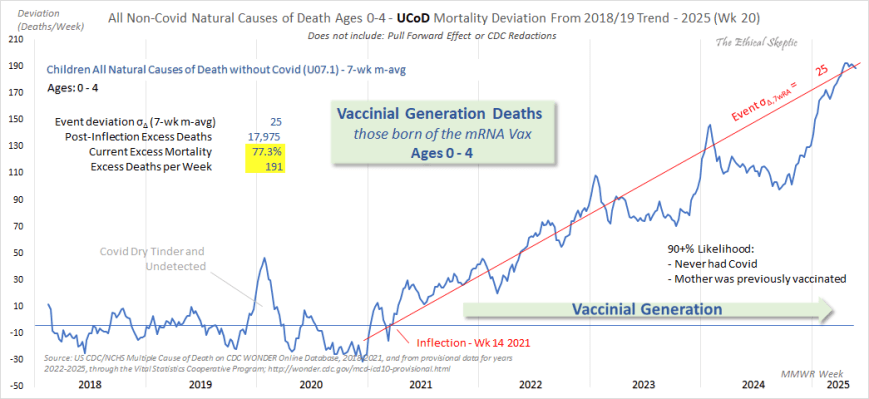
Unlike the narrower infant categories shown in Chart 1, this chart (Chart 2) captures all births occurring after the mRNA vaccination rollout. Year 2020 data is not included in baseline because of the skewing effect of both the (early in year) ‘dry tinder’ spike, as well as the temporary fall off in births later in that year (8-month dip in the blue curve).
Of note regarding retrospective sensitivity: When the cohort is expanded by one additional year (age 5), the chart remains essentially unchanged, indicating that the effect is confined specifically to the generation whose mothers were previously exposed to the mRNA vaccine. In addition, the excess mortality curve (blue line in Chart 2) is artificially depressed by the decline in the U.S. birth rate. Because the CDC has delayed publishing this US birth-rate effect (just recently completing its 2023 data), the projected baseline has not been corrected downward—meaning actual excess infant/baby mortality is 6 to 8% higher than is depicted here.5
In addition, Dr. Clare Craig, a diagnostic pathologist and co-Chair of the Hart Group, has (along with others) both replicated and performed sensitivity breakouts of this work, finding that 70 to 80% of the excess mortality has occurred in infants aged 0 to 1 year (as is replicated by TES in Chart 4 below)—a period characterized by very few vaccinations during gestation.6
Methods and data considerations
This same effect also replicates inside UK data
This data is corroborated by UK fetal anomalies
The key signal: an inflection point in Week 14 of 2021, immediately following mass vaccination of childbearing-age adults. From this point onward, all-cause mortality among 0–4 year-olds climbs persistently, reaching a deviation event size of σ = 24, or 17,975 excess deaths (77.3% above baseline). The rise is not random noise—it is systemic, compounding across multiple morbidity categories. Of significant and ominous merit, when conducting a differential-summary query by time period from the Wonder data, these ICD group dynamics mirror those same dynamics as to the impact of the mRNA vaccine in adult primary recipients:
Excess Mortality Broad ICD Grouping (Parallel Vaccinated Adult Mortality Rises):
- Renal function related (+135%)
- Meningitis related (+112%)
- Virus and septicaemia susceptibility (+90%)
- Liver/digestive disorders (+82%)
- Respiratory related (+54%)
- Congenital malformations (+51%)
- Cardiopulmonary disorders (+38%)
- Nervous/epileptic related (+37%)
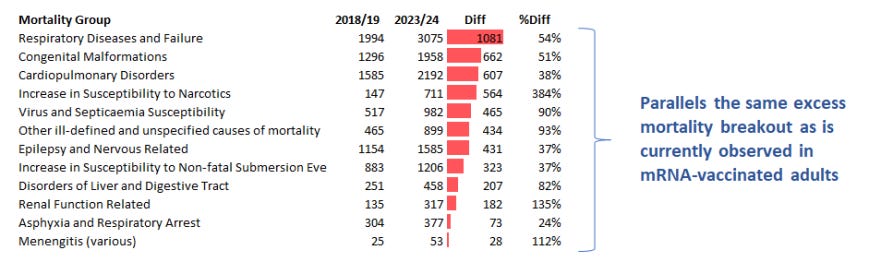
Taken together, these factors mean that the 2023/24 totals almost certainly understate the true magnitude of excess mortality during this period—yet even in this conservative form, the figures remain alarmingly elevated compared to the 2018/19 reference, particularly in a mortality cohort that had previously been in marked 25-year decline. The ranking itself, however, remains provisionally valid as a reflection of relative impact across cause-of-death categories.
Chart 4 – Persistent Bimodal Mortality Echo (Divergence) Deduction – Intergenerational Effect Derivation
Therefore, the most compelling explanation for this escalation and divergence (shown in Chart 4 below)—occurring long after vaccine uptake has fallen to nearly zero within this cohort—is an Intergenerational Covid-19 Vaccine Pre-Pregnancy Impact. This construct holds that vaccine exposure in the parental germline (oocytes, sperm, microbiome, or epigenetic programming) induces offspring susceptibility that emerges and persists across multiple age brackets. Such a mechanism would account for the blue curve (ages 0–4) rising more steeply than does the brown curve (<1 yr), as the effects are not limited to neonates but extend into early childhood. It also accords with the observation that mortality does not decline with lower immediate vaccine compliance, since the driver is already ‘baked in’ to the child’s physiology—even absent direct in-utero vaccine exposure or insult.
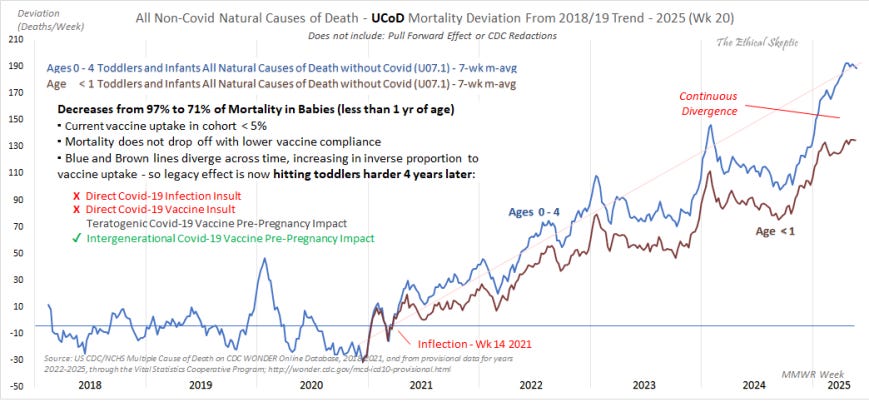
In other words, this excess mortality is neither attributable to residual sequelae of Covid-19 nor solely to direct teratogenic insult; rather, the data suggests it may derive as well from genetic inheritance conveyed through the maternal germ line.
These ICD groupings account for 7,600 deaths—41% of the excess mortality identified in Chart 2 above. The impact on the unborn is not narrow but pervasive, spanning multiple physiological domains. Such a pattern aligns more with heritable or gestationally imprinted vulnerabilities than with isolated anomalies, suggesting epigenetic disruption or even germline alteration. This is not merely a teratogenic effect on a single child, but a generational echo reverberating across thousands. While most pronounced within the first 12 months of life, the mortality effect persists—rising to account for 29% of total deaths in the cohort by 60 months of age.
This bimodal mortality echo effect (observable in the sub-cohort ‘divergence’ in Chart 4) reinforces the following set of deductive parameters upon which this inference is based (as of May 2025 data):
- First, Covid-related mortality is removed from the cohort by applying a UCoD ‘All Natural Causes of Mortality’ exclusion query, as shown in this linked image. This entailed testing is comprehensive and over-attributing in general, and is therefore renders this constraint very conservative.
- Symptomatic SARS-CoV-2 spread is now markedly lower and, according to Walgreen’s data as of April 2023, is concentrated in the vaccinated population by a factor of at least 2.6 to 1—a disparity that has only intensified since. The vast majority of children aged 0–4, more than 95.5%, fall outside that vaccinated group (Washington Post, 2025; CDC note #4 below).
- This yields a well-constrained parametric arrival function with α = 4 and β = 7, producing an asymmetric distribution of infection arrivals. The outcome is expressed in this Weibull Naïvete Age-of-First-Infection Chart. Accordingly, by May 2025 the average infant—not child—was infected with Covid along a Weibull(4,7) arrival, with exposure occurring largely after age 4 (driven by the school transmission vector). This corresponds to P(naïve by age 3.88) ≈ 91%. Importantly, this is distinct from ‘seroprevalence,’ which is confounded by maternal Covid antibody transfer, seasonal coronavirus cross-reactivity (OC43, HKU1, NL63, 229E), and maternal vaccination-derived antibodies.
- Fewer than 4.5%—and now only about 1% as of May 2025—of this cohort has been vaccinated over the past 2 years (CDC Figure 1D). Moreover, this metric has been declining rather than rising under the novel trend.
- Eighty-one percent of the parent pool has been previously vaccinated, the majority having received only the initial two doses in early 2021 (US Coronavirus vaccine tracker)—well before the majority of births within this cohort.
- Pregnant women largely stopped receiving the Covid vaccine in early 2024 (COVID-19 Vaccination Coverage, Pregnant Women, United States), yet the 0–12 month mortality signal persists, now rising steadily in magnitude compared with that observed three years earlier.
- Finally, current Covid carries far less morbidity than even the common cold—roughly one-quarter the mortality rate of influenza. It is no longer the same ‘Covid’ that circulated in 2022, which is now extinct. Consequently, ‘infection’ can be misleading when cited as a bare statistic.
Therefore, this inflection in the data cannot be attributed to primary Covid morbidity or direct vaccination. Rather, it arises from the prior vaccination of the mothers.
The fact that this data parallels with elevated mortalities in mRNA vaccinated adults is both confirmatory and particularly alarming.
Chart 5: What is an Inflection (DFT Chart)?
An inflection is a distinct (a discrete contribution that is abrupt, constrained, pronounced, and definitive), statistically significant, and sustained change in the underlying dynamics of a data series — such as its direction, rate, or variability — occuring in temporal association with a salient date, mechanism, or event. Legacy mortality trends had been in long decline; post-2021, the slope then suddenly reversed.
Deviation-from-Trend (DFT) analysis strips away seasonal fluctuations and background variation to reveal the underlying signal. This method is widely applied in fields characterized by strong seasonality—such as consumer goods forecasting, where it is used to detect sudden demand shifts hidden beneath predictable holiday or back-to-school cycles—and is equally valuable in mortality analysis. Here, it exposes the onset of the “vaccinal generation” mortality surge as a clear break from prior patterns. Without DFT, such anomalies can be obscured by averaging, linear regression, or annualization—techniques that smooth away signal and invite convenient dismissal as “random noise,” a tactic too often employed by agenda-driven defenders of the pharmaceutical narrative.
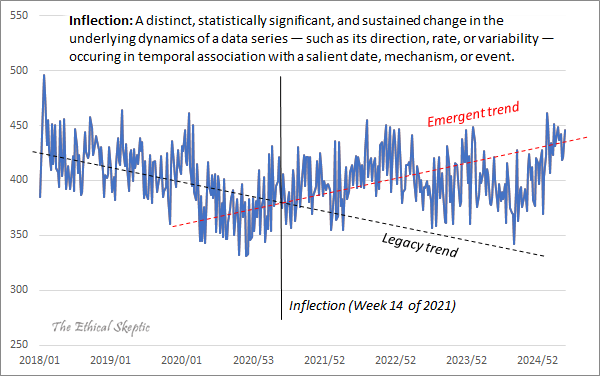
Through a comparison of Chart 2 with Chart 5 (drawn from the same source data), one can see how Chart 5 (the raw data) could invite pseudo-inflections, false trends, and specious regressions. By contrast, the deviation-from-trend (DFT) presentation in Chart 2 strips away this noise. In doing so, the method not only separates signal from noise, but also coherence from disinforming distraction.
Conclusion
As we have observed in prior analyses of systemic injury, such morbidity and mortality events rarely remain confined to “rare occurrences”; over time, they manifest across the entire recipient population, though to varying degrees of severity. For example, asbestos exposure did not produce mesothelioma in every worker, yet no exposure was without consequence—some suffered respiratory decline, others chronic inflammation, and still others terminal disease.
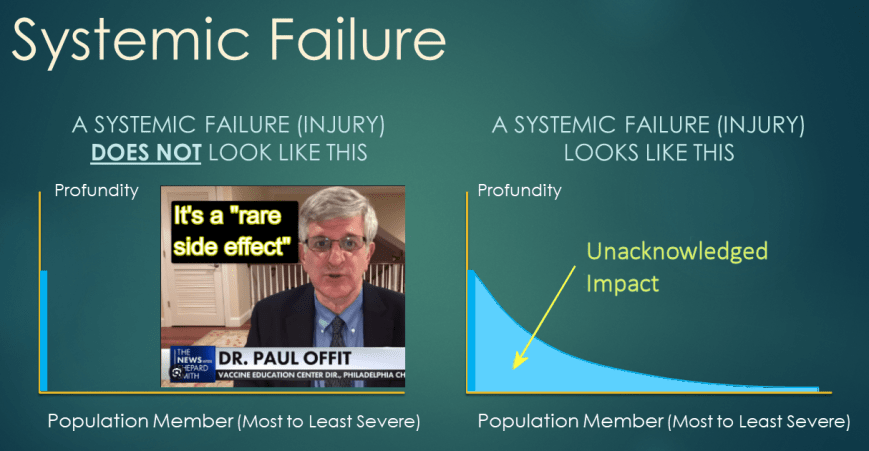
The significance of this lies in its role as a canary-in-the-coal-mine signal. Systemic interventions do not solely harm those who die immediately; they (1) impart harm on all who are exposed, to varying degrees, and (2) impose lifelong burdens of morbidity and premature mortality—diminishing both quality of life and overall lifespan for nearly everyone affected.
It is only our tendency toward a ‘red shirt bias’—dismissing early casualties as expendable or anomalous—that allows us to sidestep the sting of such signals. We always presume it won’t happen to us, numbing ourselves with that illusion, while the suffering of our fellow citizens is written off as merely an acceptable cost of our denial.
Invulnerability Bias or ‘Red Shirt Fallacy’
When a person incorrectly assumes that injury can only happen to a constrained group of persons (those wearing Star Trek’s proverbial ‘red shirts’) and not to them.
In the same way, the evidence presented here raises two problems of historic consequence:
Teratogenicity — Mortality curves in infants, neonates, and children—none of whom were exposed to either Covid-19 or its mRNA vaccine—shifted upward after decades of steady decline, coinciding with the mass introduction of mRNA vaccination to both expectant and future mothers.
Intergenerational Effect — Children born after the rollout are experiencing sustained excess mortality across multiple physiological domains, a pattern consistent with systemic biological disruption. Alarmingly, these effects mirror the very disruptions documented in adults who were direct recipients of the Covid-19 mRNA vaccine.
It should be noted that TES was the first analyst to previously and successfully identify to US Congresspersons both Excess Non-Covid Natural Cause Mortality and Excess Cancer Mortality signals using this same analytical framework—findings now broadly acknowledged in mainstream datasets. This track record underscores that the method employed here is neither speculative nor dismissible, but a proven approach to signal detection.
These signals demand immediate, transparent, and unflinching investigation. To dismiss them is not only to deny the data but to gamble recklessly with the health of the living and the yet-to-be-born alike.

The Ethical Skeptic, “Houston, We Have Another Problem”; The Ethical Skeptic, WordPress, 19 Aug 2025; Web, https://theethicalskeptic.com/2025/08/19/houston-we-have-another-problem/
- Jeng-Chang Chen, Mei-Hua Hsu, Rei-Lin Kuo, Li-Ting Wang, Ming-Ling Kuo, Li-Yun Tseng, Hsueh-Ling Chang, Cheng-Hsun Chiu, mRNA-1273 is placenta-permeable and immunogenic in the fetus, Molecular Therapy Nucleic Acids, Volume 36, Issue 1, 2025, 102489, ISSN 2162-2531; https://doi.org/10.1016/j.omtn.2025.102489(https://www.sciencedirect.com/science/article/pii/S2162253125000435)
- McCairn KM. Amyloidogenic fibrils in a post‑gestational blood climacteric. Substack. Published [publication date not specified]. Accessed August 23, 2025. Available from:
https://kevinwmccairnphd282302.substack.com/p/amyloidogenic‑fibrils‑in‑a‑post‑gestational
- Chen JC, Hsu MH, Kuo RL, Wang LT, Kuo ML, Tseng LY, Chang HL, Chiu CH. mRNA‑1273 is placenta‑permeable and immunogenic in the fetus. Mol Ther Nucleic Acids. 2025;36(1):102489. doi:10.1016/j.omtn.2025.102489
- Carla Peeters, Children’s Health: By the Numbers, Brownstone Journal; 19 Apr 2024; https://brownstone.org/articles/childrens-health-by-the-numbers/
- National Vital Statistics Reports Reports, 18 Mar 2025; Vol 7 No 1; https://www.cdc.gov/nchs/data/vsrr/vsrr035.pdf
- CDC: Weekly COVID-19 Vaccination Dashboard, May 7 2025 = 14.4% vaccinated before pregnancy with latest 2024 booster. We estimate <5%-pts were vaccinated during gestation itself with that booster.’
___
You must not wait for another catastrophic crisis (at times manufactured but we are prevented from making our own basic personal decisions or accessing needed drugs and response tools) to catch you off-guard. We must take charge and be prepared today so that we can enjoy peace of mind tomorrow.
Enter the Wellness Company as a solution and a willing participant in the health care conversation. The Wellness Company, launched in 2022, offers health care, prescriptions, and supplements, all backed by research
The Wellness Company isn’t chasing profits — it’s trying to help people recover. While the government continues pushing vaccines, The Wellness Company is focusing on real solutions.
From telemedicine, prescriptions, memberships, and supplements, TWC is leading America with alternative choices to the traditional health care model.